Search the Community
Showing results for tags 'logs'.
Found 16 results
-
 Topic:- How through which Softwares tools to retrieve BIOS errors history from bios events logs? As in my office there are 60 desktop pc of amd Ryzen 7 2700x 3700x 3800x with b450 x470 x570 b550 Asus gigabyte MSI motherboards all have UEFI BIOS and RTX 3070 RTX 3090 RTX 2080ti graphic cards used for 3d graphic designing animation video editing and used day and night for designing editing work. Operators and designers are not aquaent with hardware. Now many time due to Heavy usage the BIOS or Windows gives errors if overheating of CPU processors RAM or GPU graphic card or any system problems. I want to get the past history of such errors in BIOS PCs occurred so I have searched and finded that generally BIOS to gives errors of overheating overclocking fan errors while booting In POST . I founded about BIOS Events which records BIOS errors in some queries in some forums websites. Listed below. https://forums.tomshardware.com/threads/bios-event-log-what-does-this-mean.1555695/ https://support.siliconmechanics.com/portal/en/kb/articles/checking-smbios-event-log So I have following queries in mind and interested to know following Information regarding same:- Q1. Do UEFI BIOS records or logs any overheating or overclocking or system hardware errors or fan stopage errors or any type of BIOS errors? Do it logs in BIOS events ? Q2. If yes, then do UEFI or any BIOS events log is saved somewhere, where it is saved in chip or HDD... if yes then how can we retrieve such information from BIOS? Q3. which system softwares tools we can find the BIOS event logs and save it, can we get it into windows. https://forums.anandtech.com/threads/import-bios-events-into-windows-event-log.23627/ Q4. If BIOS don't record or have any BIOS event then is there any way how to record or log system BIOS hardware errors ?
 -
My ISP has provided me with a modem that has a built in wifi router. I've been struggling with connectivity issues over wifi for a while now. I know this could be purely WiFi related, of course. But even when we seem to have full bars on our devices and in close proximity to the modem/router we will sometimes have no connection to the internet. What I want to do is log my internet connection for a certain duration. Say an hour or 3. Or even a full day and see how often we lose connection to the internet. In order to eliminate the WiFi factor from the equation, I would connect a laptop directly to the modem, using an ethernet cable and then turn off the WiFi on the laptop. That should allow me to purely test my connection to the internet. Now my question is, how do I go about that? How can I automate testing my connection? I guess I could do some kind of ping test, but how do I log this? How can I get it to generate some kind of report that shows me all the times a connection has failed?
-
I haven't done anything that would require benchmarking in ages. Last change made to my old log file was 2014 after I changed some case fans and wanted to check if they did something to temps. This July I changed graphics card which is something I would say anyone should run their own sequence after. So after any bigger change (CPU/GPU mainly) anyone should run same benchmarks they have run before change. I will come back to this in a moment. In my situation need was really big. I went from 2011 midrange card to 2013 top end card. Something that in paper is bit better than 280X, card that I was eyeing for upgrade year ago. Yes, talking about used cards. Upgrade was from GTX 560Ti factory OC'd to reference GTX 780. Benchmarks would look awesome. In numbers if not actually, but thats more about nature of tests themselves. So why this post? Well, so I can refer to it when someone asks advice about benchmarking. Since my last run was 3 years ago and I haven't really played any new games, all my game benchmarks are pretty bad choices. Like NFS Shift and Battlefield Bad Company 2. There might be Battlefield 3, but thats it. This new batch won't have any real gameplay. Because of two reasons. 1. I still lack good games for realistic benchmarking, Battlefield 4 is probably on the heavier side. So nah on games. And 2. I don't want to buy games just because I could get good benchmark out of them. Even games with benchmark tools would be just for it since I don't play 3rd person single player adventure/action games (Metro 2033, Tomb Raider, Witcher 3). This will be list of benchmarks which are free and provide good base for anyone looking to create their own sequence. 1. What is my "sequence"? I use term "sequence" to describe procedure where I run multiple tests, check temps and mark down scores. Marking down scores and temps is good practice in general. Not just for bragging, but to check how much you spending money actually improves the systems performance. So my sequence involves having few monitoring software open, taking numbers in notepad and running several benchmarks one by one. Yes, it will take some time, some 1.5h for me. But you need to do it once and then you can just refer notes later if someone asks something. I've used temp readings many times to advice on high temps under stress tests and idles on my older hardware. To actual point. I have 10 software, 12 tests, 1 main monitoring software with 2 others running, notepad with template for scores and temps and FRAPS for one odd out fps reading. I cover tests later. I happen to have 2 monitors, but all this can be done on one monitor. 2nd is good for having all monitoring software there. Like in this manor: So MSI Afterburner is present because of habit of looking at graphs. I actually don't use it for GPU temp monitoring anymore, but habit of looking at fan and temp graphs remains. Main screen is where I look at GPU temp when test is running. Mainly since its new piece and I want to see how my fan settings are holding. Main software here is RealTemp with GPU temp monitoring open. I reset Maximum readings after every test to get reliable readings for all tests individually. Under them all is my normal main monitoring software, OpenHardwareMonitor. Notepad is on main monitor since I don't need it until after test finishes. Things I do and would recommend. I have habit of doing this after cold boot. I would recommend booting before running sequence. Its easiest way, since there's least amount of extra software running on background. For this sequence I added way of closing all extra stuff I have open. Skype, several driver software's, basically anything except multimonitor manager, fan controls and virus scanner. Some might close virus scanner too, but I don't mind it. Then another boot after all testing is done. To get everything working as normal. I would recommend setting any fan profiles like you are going to use them before running test on new components. Makes more realistic comparison. As for temps, I have idle's. Which I will take after first test has run. Reason being that idle's coming directly from boot will be lower than what you are going to see any other time. For testing temps I use max temp. Its most relevant. Since RealTemp shows temps for all cores, I use average with easy count. Take highest and lowest and split difference with upward rounding. Like 66C and 58C would be 62C (8/2=4, 58+4=62C) or 67C and 60C would be 64C (7/2=3.5, round up 4). 2. Tests and score keeping Let's start with synthetic benchmarks. I will give some background on why I use software listed here, where to get it and what settings to use (if needed). 3DMark https://www.futuremark.com/downloads/3dmark.zip If you have had gaming PC for some time, you know this software already. Futuremark's (Yay! for Finnish company) 3DMark has been industry standard for almost 20 years. Its combined benchmark, meaning that it tests both GPU and CPU within single run. First 3DMark I've used is 3DMark03. I've had 05, 06. Vantage and 11. 3DMark06 was used for long time because of its DX9 support. Until Vantage with DX10.1 it was only thing to test new hardware reliably. Thats important. Because of the way benchmarks work, if you change something the score will also differ. So comparing two results between different versions of software can cause issues. I first noticed this fact with FurMark. But back to 3DMark. Free version has 3-4 tests. Most common is FireStrike which is for current gen gaming PCs. You can run it with lower end hardware if you are like me and want before upgrade scores to compare. I also used tad lighter SkyDiver. Mainly because I couldn't get 06 running anymore. So let both tests run, mark score to notepad, mark max temps for GPU and CPU, remember to let temps go back to "idle" in between and reset max readings before running the test. Thats it. Free version doesn't have any settings to toggle. Only thing I would like to toggle is Demo. CINEBENCH R15 Yes, they actually have product name in caps. Maxon makes professional 3D modeling and animation software as their main source of income. But Cinebench has become one reason for their homepage to get constant traffic. It has 2 tests, individually for CPU and GPU. GPU uses OpenCL, CPU renders image using all available threads. Cinebench gives some comparison for similar systems, but I wouldn't look that graph too much. I also don't think it as very taxing software. Run tests for both CPU and GPU, with temp normalization in between. This is among those software with this batch that has single part focus on testing. I don't have just for CPU, but I might look into that part more. Intel Extreme Tuning Utility has CPU testing, but I don't know if it works with AMD. Anyway, having whole benchmark just for single component has some advantages. Like if you'd like to test air cooling myth about radiating GPU heat. So running GPU only test would raise only GPUs temp notably and do something to CPUs temp also. I don't look at utilization when I run these tests, but it could be one thing to check also if you want to gather more data. Catzilla http://www.catzilla.com/download ALLBenchmark's test is different from the two above because it has very noticeable sound effects and music. Otherwise its just another combined benchmark. I've used it since I heard about it from OC3D's TinyTomLogan. TTL is someone who's opinion on OC and CPU performance means a lot to me. I've picked other go-to software from him with OCCT, a stress test software for CPU. But back to Catzilla. Basic version only has 540p benchmark, but you get 720p one by creating account to their site. Easy thing with Google, Twitter or Facebook linking. Rest of the stuff is like before. RealBench https://rog.asus.com/rog-pro/realbench-v2-leaderboard/ ASUS' RealBench is combined test which uses real life tasks for benchmarking. Image manipulation, rendering, video encoding and multitasking. Besides giving total score, you get score per test. I mark all of them down. I got to see how much GPU did bottleneck CPU on CPU heavy tasks. Result? Not that much. But some. UserBenchmark This is new to my lineup. I haven't looked much into what it actually measures. But looks to be lighter side combined test. I would say it replaces Novabench I had on earlier lineup. Results are given in three categories, for Gaming, Desktop and Workstation in percentage. I marked those percentages as results. Heaven and Valley These two from Unigine are pure GPU tests. Heaven is what is commonly used for GPU OC testing, temp testing and benchmarking by reviewers. Valley is bit heavier, so I'd say running them both is good practice. Like with 3DMark, there are more tests you can use. I used highest presets for both, Extreme for Heaven and ExtremeHD for Valley. FFXIV: Stormblood Like said earlier, I don't have real gameplay benchmarks in this set. So this game from 2013 is lower end gaming benchmark for me. It has preset for Mazximum settings, but I pumped those bit more. You can check my settings from PDF attached. I use score as scoring, but you could have also given FPS. (FFXIV_Stormbloo_benchmark_LoGiCalDrm_config.pdf) Star Swarm http://store.steampowered.com/app/267130/Star_Swarm_Stress_Test/ This game engine benchmark is free on Steam. Released 2014 by Oxide Games, guys behind Ashes of Singularity, its has capability of simulating space battle game. There are few options to simulate different style of games. I used Attract with Extreme settings. Score will be given as average FPS. You can select some other combination, important part being that same settings are used before and after any upgrade made to keep score consistent. demo2 https://files.scene.org/view/parties/2015/assembly15/demo/demo2_by_ekspert.zip This one is something I cooked up. Its newer than both other gaming style benchmarks, its done with Unreal Engine 4 and I have no clue if it has any relation to real world or not. Its Demo made by group called Ekspert for Assembly LAN Demo Compo 2015, in which it placed 2nd. There are few remarks I want to make about demo's and demoscene before going actual benchmarking part. Demoscene is all about digital art. Animation, coding, graphics, music, indie game development. At least in Europe, many software and game dev companies have their roots deep into demoscene. If you are doing the things I mentioned above and want to show off your skills by competing, maybe look if there are parties/compo's held in your area. The two known Finnish companies with demoscene background are Futuremark (surprise, surprise) and Rovio. One for making first PC demo at the time when Amiga and Commodore 64 were main platforms, other for making mobile game back when those were played on Nokia N-Cage's. Now back to benchmarking part. Demo2 doesn't have built-in scoring system. So I've used FRAPS to calculate average FPS. Running 1080p version gives warning about using Fraps for recording purposes, but loads just fine after that. I start benchmark counter as soon as demo starts and check scores afterwards. Nothing more to it. Others? As I said along the lines, I would like to have more modern game benchmarks, as well as CPU only benchmark. So I will be looking around for those and adding them here. If someone reading this has ideas about free or cheap games with included benchmarks, please let me know. 3. Scores and comparison At this point you should have raw data text file. Something like this one I'm using: benchmsrk.txt Which includes system specs for each test cycle. This would be the file you are updating during tests. Feel free to use it as template or comparison. But what now? Well, you can just compare by eye results, use it to quickly refer temps and so on. But what if you want know how much better system performance is after upgrade. Thats where Excel (or Sheets, Calc and so on) comes in. Copying results to Excel (&co) can be annoying, but do it once to get template correct and maybe adjust .txt file to help in future. Here's my .xlsx for reference. Also free to be used as template or comparison: benchmark_LoGiCalDrm.xlsx In file I've got some extended system info and notes about tests. Which are pretty much same as in here. But main thing is +- column (Excel hint: add < ' > in front of symbol to exclude any automatic formula). It calculates how many percentage better new score is compared to last. Works best when score changes less than 100% or new score is over twice the value of old. Formula used is pretty simple: =(<new>/<old>)-1 Shown in percentage. You can add color coding and such if needed. If new value are over twice bigger, remove <-1> to get accurate score. There's some oddness in that file in CPU temps. I had issue with Speedfan missing fan profiles for 2 front intakes. Which I fixed after I had changed to new GPU. So those are something to ignore. 4. Conclusion I hope this helps those who are new to benchmarking. Note that this is just how I do things and you should be taking it as guide or advice. Make it your own. I will be doing some fixes along the lines, but as I will not be getting major upgrade in few years, its quite possible I'll be making another batch of tests when next upgrade is on me.
-
Hi everyone, this is something i've been observing on my system and couldn't find a solution elsewhere. In the Windows 10 resource monitor i see the system writing 24x7 to C:\ProgramData\NVIDIA\. The file names start with MessageBus and MessageBusBroadcast. Is is just some KB/s but doing that 24/7 can't be all good for the flash memory. Is there a way to disable it? PS: Win 10 with a GTX 950.
-
 Hi everyone. im trying to install macos mojave in imac 2012. Installation keeps on failing. but after trying again it rebooted to prompt telling me that installation failed and gave me installation logs to save(Im attaching the logs). Im unable to understand them. Can anybody please help me to figure out what is the problem by going through the logs. Installer Log 22-Apr-2020.txt
 -

logs How do I log programs that has been running/stopped?
kevincatssing posted a topic in Troubleshooting
For a while now there is this one unknown console like window popping up at random times and it was too fast for me to see what it was. Its getting quite annoying and I am getting worried. I've ran antivirus and Malwarebytes scans, they both shows clean results. Is there a way for me to log programs that has been running/stopped so I can figure out what the program is and continue on there? I've searched the web for similar topics and I found one but it was for Windows 7 so I'm not sure if its applicable for me + I don't know how to do it. (The thread about it) (I've uploaded an image of my computer specs, not really sure if its relevant but thats what the pinned guide told me to do, and also have a complimentary picture of my cat! Sorry if I posted on the wrong sub-forum, and hope you guys can help me)
-

Best way to see total operating hours on Android?
FlpDaMattress posted a topic in Phones and Tablets
Alright, So i just bought a refurbished Note 9 as an upgrade from my S8 and I've been loving it. But a refurb is a refurb, and I'm extremely curious as to how used this phone actually is. Every bit of digging online only directs me to uptime in settings or rando apps that log how you use your phone specifically. Not even close to what i want. How many hours has this phone been in use in it's lifetime? I'm sure this is logged, But I have no idea where. -
I thought today was the day I lost my 512 GB boot drive. With a 50% used, to suddenly warning me that I had no more space. S.M.A.R.T utility indicated no issues and i could not find and viruses. Turns out that I have a file within /appdata called "backend.log.bak" that appeared today and took up over 250 GB. Seemingly created out of nowhere. Anyone else had this issue?
-
 Summary Hong Kong based UFO VPN exposed millions of log files about users of its service, including their account passwords and IP addresses, despite claiming that it keeps no logs. My thoughts Mandatory by government perhaps? or just a chineese government business? Sources https://www.comparitech.com/blog/vpn-privacy/ufo-vpn-data-exposure/
 -
All of My accounts etc have been getting hacked for a long time which makes me believe someone is doing a mitm, or evil twin attack. Maybe even have malware on one of my devices, even though ive changed all my accounts, Passwords, wiped devices, etc. Got a new router and modem aswell hoping it would stop it and give me more insight into whats happening. My touters logs are just full of dropped packets constantly, its every few seconds. Heres an example. Any help / advice would be great. Aug 20 13:52:58 kernel: DROP IN=eth0 OUT= MAC=d4:5d:64:a4:6a:10:0c:a4:02:46:a4:01:08:00 SRC=185.39.11.32 DST=90.206.58.122 LEN=40 TOS=0x00 PREC=0x00 TTL=250 ID=22333 PROTO=TCP SPT=47975 DPT=55006 SEQ=4225612697 ACK=0 WINDOW=1024 RES=0x00 SYN URGP=0 MARK=0x8000000 Aug 20 13:53:01 kernel: DROP IN=eth0 OUT= MAC=d4:5d:64:a4:6a:10:0c:a4:02:46:a4:01:08:00 SRC=91.229.112.5 DST=90.206.58.122 LEN=40 TOS=0x00 PREC=0x00 TTL=248 ID=39995 PROTO=TCP SPT=47190 DPT=1331 SEQ=72328050 ACK=0 WINDOW=1024 RES=0x00 SYN URGP=0 MARK=0x8000000 Aug 20 13:53:01 kernel: DROP IN=eth0 OUT= MAC=d4:5d:64:a4:6a:10:0c:a4:02:46:a4:01:08:00 SRC=87.251.74.18 DST=90.206.58.122 LEN=40 TOS=0x00 PREC=0x00 TTL=247 ID=28213 PROTO=TCP SPT=46847 DPT=10015 SEQ=2731176784 ACK=0 WINDOW=1024 RES=0x00 SYN URGP=0 MARK=0x8000000 Aug 20 13:53:06 kernel: DROP IN=eth0 OUT= MAC=ff:ff:ff:ff:ff:ff:00:1d:aa:98:6f:7c:08:00 SRC=0.0.0.0 DST=255.255.255.255 LEN=144 TOS=0x00 PREC=0x00 TTL=254 ID=47934 PROTO=UDP SPT=8728 DPT=4944 LEN=124 MARK=0x8000000 Aug 20 13:53:16 kernel: DROP IN=eth0 OUT= MAC=ff:ff:ff:ff:ff:ff:00:1d:aa:98:6f:7c:08:00 SRC=0.0.0.0 DST=255.255.255.255 LEN=144 TOS=0x00 PREC=0x00 TTL=254 ID=47935 PROTO=UDP SPT=8841 DPT=4944 LEN=124 MARK=0x8000000 Aug 20 13:53:19 kernel: ACCEPT IN=br0 OUT=eth0 MAC=d4:5d:64:a4:6a:10:24:4b:fe:6e:0d:6b:86:dd SRC=2a02:0c7f:d03a:5500:cc90:8b1a:c249:ffdd DST=2a00:1450:4009:0808:0000:0000:0000:2004 LEN=1378 TC=0 HOPLIMIT=63 FLOWLBL=0 PROTO=UDP SPT=64989 DPT=443 LEN=1338 Aug 20 13:53:19 kernel: ACCEPT IN=br0 OUT=eth0 MAC=d4:5d:64:a4:6a:10:24:4b:fe:6e:0d:6b:86:dd SRC=2a02:0c7f:d03a:5500:cc90:8b1a:c249:ffdd DST=2a00:1450:4009:0808:0000:0000:0000:2004 LEN=1378 TC=0 HOPLIMIT=63 FLOWLBL=0 PROTO=UDP SPT=64990 DPT=443 LEN=1338 Aug 20 13:53:20 kernel: DROP IN=eth0 OUT= MAC=d4:5d:64:a4:6a:10:0c:a4:02:46:a4:01:08:00 SRC=83.97.20.31 DST=90.206.58.122 LEN=40 TOS=0x00 PREC=0x00 TTL=246 ID=54321 PROTO=TCP SPT=41185 DPT=80 SEQ=1716051536 ACK=0 WINDOW=65535 RES=0x00 SYN URGP=0 MARK=0x8000000 Aug 20 13:53:26 kernel: DROP IN=eth0 OUT= MAC=ff:ff:ff:ff:ff:ff:00:1d:aa:98:6f:7c:08:00 SRC=0.0.0.0 DST=255.255.255.255 LEN=144 TOS=0x00 PREC=0x00 TTL=254 ID=47936 PROTO=UDP SPT=8911 DPT=4944 LEN=124 MARK=0x8000000 Aug 20 13:53:33 kernel: DROP IN=eth0 OUT= MAC=d4:5d:64:a4:6a:10:0c:a4:02:46:a4:01:08:00 SRC=192.35.168.232 DST=90.206.58.122 LEN=44 TOS=0x00 PREC=0x00 TTL=38 ID=6648 PROTO=TCP SPT=18169 DPT=12171 SEQ=455501482 ACK=0 WINDOW=1024 RES=0x00 SYN URGP=0 OPT (020405B4) MARK=0x8000000 Aug 20 13:53:33 kernel: DROP IN=eth0 OUT= MAC=01:00:5e:00:00:01:00:1d:aa:98:6f:7c:08:00 SRC=192.168.2.1 DST=224.0.0.1 LEN=40 TOS=0x00 PREC=0x00 TTL=1 ID=11196 OPT (94040000) PROTO=2 MARK=0x8000000 Aug 20 13:53:34 kernel: DROP IN=eth0 OUT=br0 MAC=d4:5d:64:a4:6a:10:0c:a4:02:46:a4:01:86:dd SRC=2600:9000:21f7:1200:000d:274d:a6c0:93a1 DST=2a02:0c7f:d03a:5500:9090:30ca:f48e:f025 LEN=106 TC=0 HOPLIMIT=52 FLOWLBL=285353 PROTO=TCP SPT=443 DPT=58538 SEQ=800977019 ACK=1754448095 WINDOW=117 RES=0x00 ACK PSH URGP=0 MARK=0x8000000 Aug 20 13:53:34 kernel: DROP IN=eth0 OUT=br0 MAC=d4:5d:64:a4:6a:10:0c:a4:02:46:a4:01:86:dd SRC=2600:9000:21f7:1200:000d:274d:a6c0:93a1 DST=2a02:0c7f:d03a:5500:9090:30ca:f48e:f025 LEN=91 TC=0 HOPLIMIT=52 FLOWLBL=285353 PROTO=TCP SPT=443 DPT=58538 SEQ=800977065 ACK=1754448095 WINDOW=117 RES=0x00 ACK PSH URGP=0 MARK=0x8000000 Aug 20 13:53:34 kernel: DROP IN=eth0 OUT=br0 MAC=d4:5d:64:a4:6a:10:0c:a4:02:46:a4:01:86:dd SRC=2600:9000:21f7:b800:0018:4532:5280:93a1 DST=2a02:0c7f:d03a:5500:9090:30ca:f48e:f025 LEN=106 TC=0 HOPLIMIT=52 FLOWLBL=302514 PROTO=TCP SPT=443 DPT=58465 SEQ=2301177167 ACK=844297420 WINDOW=117 RES=0x00 ACK PSH URGP=0 MARK=0x8000000 Aug 20 13:53:34 kernel: DROP IN=eth0 OUT=br0 MAC=d4:5d:64:a4:6a:10:0c:a4:02:46:a4:01:86:dd SRC=2600:9000:21f7:b800:0018:4532:5280:93a1 DST=2a02:0c7f:d03a:5500:9090:30ca:f48e:f025 LEN=91 TC=0 HOPLIMIT=52 FLOWLBL=302514 PROTO=TCP SPT=443 DPT=58465 SEQ=2301177213 ACK=844297420 WINDOW=117 RES=0x00 ACK PSH URGP=0 MARK=0x8000000 Aug 20 13:53:34 kernel: DROP IN=eth0 OUT=br0 MAC=d4:5d:64:a4:6a:10:0c:a4:02:46:a4:01:86:dd SRC=2600:9000:21f7:1200:000d:274d:a6c0:93a1 DST=2a02:0c7f:d03a:5500:9090:30ca:f48e:f025 LEN=106 TC=0 HOPLIMIT=52 FLOWLBL=33121 PROTO=TCP SPT=443 DPT=58538 SEQ=800977019 ACK=1754448095 WINDOW=117 RES=0x00 ACK PSH URGP=0 MARK=0x8000000 Aug 20 13:53:34 kernel: DROP IN=eth0 OUT=br0 MAC=d4:5d:64:a4:6a:10:0c:a4:02:46:a4:01:86:dd SRC=2600:9000:21f7:b800:0018:4532:5280:93a1 DST=2a02:0c7f:d03a:5500:9090:30ca:f48e:f025 LEN=106 TC=0 HOPLIMIT=52 FLOWLBL=1014372 PROTO=TCP SPT=443 DPT=58465 SEQ=2301177167 ACK=844297420 WINDOW=117 RES=0x00 ACK PSH URGP=0 MARK=0x8000000 Aug 20 13:53:34 kernel: DROP IN=eth0 OUT=br0 MAC=d4:5d:64:a4:6a:10:0c:a4:02:46:a4:01:86:dd SRC=2600:9000:21f7:1200:000d:274d:a6c0:93a1 DST=2a02:0c7f:d03a:5500:9090:30ca:f48e:f025 LEN=106 TC=0 HOPLIMIT=52 FLOWLBL=1001439 PROTO=TCP SPT=443 DPT=58538 SEQ=800977019 ACK=1754448095 WINDOW=117 RES=0x00 ACK PSH URGP=0 MARK=0x8000000 Aug 20 13:53:35 kernel: DROP IN=eth0 OUT=br0 MAC=d4:5d:64:a4:6a:10:0c:a4:02:46:a4:01:86:dd SRC=2600:9000:21f7:b800:0018:4532:5280:93a1 DST=2a02:0c7f:d03a:5500:9090:30ca:f48e:f025 LEN=106 TC=0 HOPLIMIT=52 FLOWLBL=995362 PROTO=TCP SPT=443 DPT=58465 SEQ=2301177167 ACK=844297420 WINDOW=117 RES=0x00 ACK PSH URGP=0 MARK=0x8000000 Aug 20 13:53:35 kernel: DROP IN=eth0 OUT=br0 MAC=d4:5d:64:a4:6a:10:0c:a4:02:46:a4:01:86:dd SRC=2600:9000:21f7:1200:000d:274d:a6c0:93a1 DST=2a02:0c7f:d03a:5500:9090:30ca:f48e:f025 LEN=106 TC=0 HOPLIMIT=52 FLOWLBL=38692 PROTO=TCP SPT=443 DPT=58538 SEQ=800977019 ACK=1754448095 WINDOW=117 RES=0x00 ACK PSH URGP=0 MARK=0x8000000 Aug 20 13:53:36 kernel: DROP IN=eth0 OUT=br0 MAC=d4:5d:64:a4:6a:10:0c:a4:02:46:a4:01:86:dd SRC=2600:9000:21f7:b800:0018:4532:5280:93a1 DST=2a02:0c7f:d03a:5500:9090:30ca:f48e:f025 LEN=106 TC=0 HOPLIMIT=52 FLOWLBL=708294 PROTO=TCP SPT=443 DPT=58465 SEQ=2301177167 ACK=844297420 WINDOW=117 RES=0x00 ACK PSH URGP=0 MARK=0x8000000 Aug 20 13:53:36 kernel: DROP IN=eth0 OUT= MAC=ff:ff:ff:ff:ff:ff:00:1d:aa:98:6f:7c:08:00 SRC=0.0.0.0 DST=255.255.255.255 LEN=144 TOS=0x00 PREC=0x00 TTL=254 ID=47937 PROTO=UDP SPT=8990 DPT=4944 LEN=124 MARK=0x8000000 Aug 20 13:53:37 kernel: DROP IN=eth0 OUT=br0 MAC=d4:5d:64:a4:6a:10:0c:a4:02:46:a4:01:86:dd SRC=2600:9000:21f7:1200:000d:274d:a6c0:93a1 DST=2a02:0c7f:d03a:5500:9090:30ca:f48e:f025 LEN=106 TC=0 HOPLIMIT=52 FLOWLBL=9710 PROTO=TCP SPT=443 DPT=58538 SEQ=800977019 ACK=1754448095 WINDOW=117 RES=0x00 ACK PSH URGP=0 MARK=0x8000000 Aug 20 13:53:37 kernel: DROP IN=eth0 OUT=br0 MAC=d4:5d:64:a4:6a:10:0c:a4:02:46:a4:01:86:dd SRC=2600:9000:21f7:b800:0018:4532:5280:93a1 DST=2a02:0c7f:d03a:5500:9090:30ca:f48e:f025 LEN=106 TC=0 HOPLIMIT=52 FLOWLBL=748605 PROTO=TCP SPT=443 DPT=58465 SEQ=2301177167 ACK=844297420 WINDOW=117 RES=0x00 ACK PSH URGP=0 MARK=0x8000000 Aug 20 13:53:44 kernel: ACCEPT IN=br0 OUT=eth0 MAC=d4:5d:64:a4:6a:10:24:4b:fe:6e:0d:6b:86:dd SRC=2a02:0c7f:d03a:5500:cc90:8b1a:c249:ffdd DST=2a02:26f0:0137:0000:0000:0000:0215:4b18 LEN=72 TC=0 HOPLIMIT=63 FLOWLBL=254918 PROTO=TCP SPT=51005 DPT=443 SEQ=1533365052 ACK=0 WINDOW=64800 RES=0x00 SYN URGP=0 OPT (020405A00103030801010402) Aug 20 13:53:46 kernel: DROP IN=eth0 OUT= MAC=ff:ff:ff:ff:ff:ff:00:1d:aa:98:6f:7c:08:00 SRC=0.0.0.0 DST=255.255.255.255 LEN=144 TOS=0x00 PREC=0x00 TTL=254 ID=47938 PROTO=UDP SPT=9078 DPT=4944 LEN=124 MARK=0x8000000 Aug 20 13:53:48 kernel: DROP IN=eth0 OUT= MAC=d4:5d:64:a4:6a:10:0c:a4:02:46:a4:01:08:00 SRC=185.176.27.34 DST=90.206.58.122 LEN=40 TOS=0x00 PREC=0x00 TTL=245 ID=36139 PROTO=TCP SPT=46910 DPT=8001 SEQ=2882709520 ACK=0 WINDOW=1024 RES=0x00 SYN URGP=0 MARK=0x8000000 Aug 20 13:53:56 kernel: DROP IN=eth0 OUT= MAC=ff:ff:ff:ff:ff:ff:00:1d:aa:98:6f:7c:08:00 SRC=0.0.0.0 DST=255.255.255.255 LEN=144 TOS=0x00 PREC=0x00 TTL=254 ID=47939 PROTO=UDP SPT=9175 DPT=4944 LEN=124 MARK=0x8000000 Aug 20 13:53:57 kernel: DROP IN=eth0 OUT= MAC=d4:5d:64:a4:6a:10:0c:a4:02:46:a4:01:08:00 SRC=185.156.73.57 DST=90.206.58.122 LEN=40 TOS=0x00 PREC=0x00 TTL=250 ID=17855 PROTO=TCP SPT=59609 DPT=55974 SEQ=889890147 ACK=0 WINDOW=1024 RES=0x00 SYN URGP=0 MARK=0x8000000 Aug 20 13:54:06 kernel: DROP IN=eth0 OUT= MAC=ff:ff:ff:ff:ff:ff:00:1d:aa:98:6f:7c:08:00 SRC=0.0.0.0 DST=255.255.255.255 LEN=144 TOS=0x00 PREC=0x00 TTL=254 ID=47940 PROTO=UDP SPT=9281 DPT=4944 LEN=124 MARK=0x8000000 Aug 20 13:54:16 kernel: DROP IN=eth0 OUT= MAC=ff:ff:ff:ff:ff:ff:00:1d:aa:98:6f:7c:08:00 SRC=0.0.0.0 DST=255.255.255.255 LEN=144 TOS=0x00 PREC=0x00 TTL=254 ID=47941 PROTO=UDP SPT=9396 DPT=4944 LEN=124 MARK=0x8000000
-
Just some data I have spanning all the way back to 9/9/2017 at 4:54PM. Page 5 has a graph and as you can see I've been working on making it more detailed (See page 1 and the table on the right). All testing was done as follows. Connection: Cat6a 5ft Modem: NetGear CM1000 Router: NetGear R6250 (Not used for 90% of the tests. 90% of tests where done wired to modem. ALL TESTS WHERE DONE WIRED. Only 10% of tests had something in between client and modem.) ISP: xFinity from Comcast Location: Exeter, NH Speeds Paid For: "Gigabit Internet Tier" all advertisements say "Gigabit" but when you buy it and look under MY ACCOUNT>Devices>Scroll to the bottom>Read the words "Internet Plan:(insert your plan)" and "Internet Tier Download Speed: 986.5Mbps Upload Speed: 35Mbps(Numbers listed is for the plan "Gigabit" Computer: CPU:R7 1700x GPU1:980ti GPU2:1060 6gb RAM:16gb DDR4 2866 14-14-14-30 MOBO: MSI SLI PLUS x370 C:/Drive: 120gb 850 evo Site for testing: speedtest.net Link to Published Spread Sheet (Should be self updating as I add data): https://docs.google.com/spreadsheets/d/e/2PACX-1vT-NJaPGqkS0EnqY3RJudEsgsOIK-tVr-O2jne7HYZNu1I4crN0SXNtX1NJcm4ky1ixuj_oeOWecTU_/pubhtml Attached is a copy of the spread sheet (less up to date as I need to update manually) Please share this with everyone you can. I've be working hard on this, using my time to collect and assemble this data. Any feedback is welcome along with ideas and suggestions. I hope you all find this helpful and meaning full in some way, cause I have. I've been using it to talk with Comcast on fixing the issue. NetGear and my self have both concluded that the issue is not on my end (Found issue in the bonded channels so Comcast came and thought replacing the coax fittings inside my house would help. It didn't I posted the before and after of that below.) and that the issue is either the cable from the street to my home or the cable from my street to the ISP. Either way its really annoying paying for "Gigabit" and getting served a speed that is so much slower you could fit a few different combinations of all their slower packages in the gap between my speed and the speed I pay for, not to mention the inconsistency in the speed. These test have been run at all hours of the day/night and it doesn't seem to be affected by high traffic hours. Anyway I will probably tweet this at Comcast and see what they think. Before Comcast replaced the fittings Frequency start Value This field below allows you to modify the frequency the cable modem start with its scan during initialization and registration. Enter the new start frequency and restart the cable modem for it to take effect. Starting Frequency <tabindex=-1>Startup Procedure Procedure Status Comment Acquire Downstream Channel 639000000 Hz Locked Connectivity State OK Operational Boot State OK Operational Security Enable BPI+ IP Provisioning Mode Honor MDD IPv6 only <tabindex=-1>Downstream Bonded Channels Channel Lock Status Modulation Channel ID Frequency Power SNR / MER Unerrored Codewords Correctable Codewords Uncorrectable Codewords 1 Locked QAM256 21 639000000 Hz -6.8 dBmV 39.9 dB 3428725165 0 0 2 Locked QAM256 1 519000000 Hz -4.5 dBmV 41.5 dB 3427437059 0 0 3 Locked QAM256 2 525000000 Hz -4.8 dBmV 41.5 dB 3427445740 0 0 4 Locked QAM256 3 531000000 Hz -5.1 dBmV 41.4 dB 3427445293 0 0 5 Locked QAM256 4 537000000 Hz -5.3 dBmV 41.2 dB 3427464622 0 0 6 Locked QAM256 5 543000000 Hz -5.5 dBmV 41.1 dB 3427473790 0 0 7 Locked QAM256 6 549000000 Hz -5.3 dBmV 41.2 dB 3427483200 0 0 8 Locked QAM256 7 555000000 Hz -5.5 dBmV 41.1 dB 3427492220 0 0 9 Locked QAM256 8 561000000 Hz -5.4 dBmV 41.1 dB 3427541585 0 0 10 Locked QAM256 9 567000000 Hz -5.7 dBmV 40.9 dB 3427551286 0 0 11 Locked QAM256 10 573000000 Hz -5.6 dBmV 40.9 dB 3427560274 0 0 12 Locked QAM256 11 579000000 Hz -5.9 dBmV 40.7 dB 3427569778 0 0 13 Locked QAM256 12 585000000 Hz -6.0 dBmV 40.7 dB 3427579246 0 0 14 Locked QAM256 13 591000000 Hz -5.9 dBmV 40.7 dB 3427588790 0 0 15 Locked QAM256 14 597000000 Hz -6.4 dBmV 40.4 dB 3427597530 0 0 16 Locked QAM256 15 603000000 Hz -6.3 dBmV 40.4 dB 3427607258 0 0 17 Locked QAM256 16 609000000 Hz -6.6 dBmV 40.1 dB 3427660318 0 0 18 Locked QAM256 17 615000000 Hz -6.4 dBmV 40.3 dB 3427678864 0 0 19 Locked QAM256 18 621000000 Hz -7.0 dBmV 40.0 dB 3427688095 0 0 20 Locked QAM256 19 627000000 Hz -6.7 dBmV 40.1 dB 3427697076 0 0 21 Locked QAM256 20 633000000 Hz -6.6 dBmV 40.2 dB 3427705472 0 0 22 Locked QAM256 22 645000000 Hz -7.2 dBmV 39.5 dB 3427714803 0 0 23 Locked QAM256 23 651000000 Hz -6.8 dBmV 39.4 dB 3427733260 0 0 24 Locked QAM256 24 657000000 Hz -7.5 dBmV 39.3 dB 3427728548 0 0 25 Not Locked Unknown 0 0 Hz 0.0 dBmV 0.0 dB 0 0 0 26 Not Locked Unknown 0 0 Hz 0.0 dBmV 0.0 dB 0 0 0 27 Not Locked Unknown 0 0 Hz 0.0 dBmV 0.0 dB 0 0 0 28 Not Locked Unknown 0 0 Hz 0.0 dBmV 0.0 dB 0 0 0 29 Not Locked Unknown 0 0 Hz 0.0 dBmV 0.0 dB 0 0 0 30 Not Locked Unknown 0 0 Hz 0.0 dBmV 0.0 dB 0 0 0 31 Not Locked Unknown 0 0 Hz 0.0 dBmV 0.0 dB 0 0 0 32 Not Locked Unknown 0 0 Hz 0.0 dBmV 0.0 dB 0 0 0 <tabindex=-1>Upstream Bonded Channels Channel Lock Status Modulation Channel ID Frequency Power 1 Locked ATDMA 1 36500000 Hz 45.0 dBmV 2 Locked ATDMA 2 30100000 Hz 45.0 dBmV 3 Locked ATDMA 3 23700000 Hz 44.0 dBmV 4 Locked ATDMA 4 17300000 Hz 44.5 dBmV 5 Not Locked Unknown 0 0 Hz 0.0 dBmV 6 Not Locked Unknown 0 0 Hz 0.0 dBmV 7 Not Locked Unknown 0 0 Hz 0.0 dBmV 8 Not Locked Unknown 0 0 Hz 0.0 dBmV <tabindex=-1>Downstream OFDM Channels Channel Lock Status Modulation / Profile ID Channel ID Frequency Power SNR / MER Active Subcarrier Number Range Unerrored Codewords Correctable Codewords Uncorrectable Codewords 1 Locked 0, 1 159 702000000 Hz -6.0 dBmV 38.3 dB 1126 ~ 2969 2924879599 26384 1 2 Not Locked 0 0 0 Hz -1.9 dBmV 0.0 dB 0 ~ 4095 0 0 0 <tabindex=-1>Upstream OFDMA Channels Channel Lock Status Modulation / Profile ID Channel ID Frequency Power 1 Not Locked Unknown 0 0 Hz 0 dBmV 2 Not Locked Unknown 0 0 Hz 0 dBmV Current System Time: Thu Apr 26 11:56:36 2018 After Comcast replaced the fittings Frequency start Value This field below allows you to modify the frequency the cable modem start with its scan during initialization and registration. Enter the new start frequency and restart the cable modem for it to take effect. Starting Frequency Startup Procedure Procedure Status Comment Acquire Downstream Channel 591000000 Hz Locked Connectivity State OK Operational Boot State OK Operational Security Enable BPI+ IP Provisioning Mode Honor MDD IPv6 only Downstream Bonded Channels Channel Lock Status Modulation Channel ID Frequency Power SNR / MER Unerrored Codewords Correctable Codewords Uncorrectable Codewords 1 Locked QAM256 13 591000000 Hz -6.0 dBmV 40.5 dB 419078101 0 0 2 Locked QAM256 1 519000000 Hz -4.1 dBmV 41.5 dB 417459042 0 0 3 Locked QAM256 2 525000000 Hz -4.3 dBmV 41.4 dB 417467811 0 0 4 Locked QAM256 3 531000000 Hz -4.4 dBmV 41.3 dB 417477190 0 0 5 Locked QAM256 4 537000000 Hz -4.7 dBmV 41.2 dB 417486467 0 0 6 Locked QAM256 5 543000000 Hz -4.8 dBmV 41.2 dB 417495412 0 0 7 Locked QAM256 6 549000000 Hz -4.9 dBmV 41.2 dB 417504713 0 0 8 Locked QAM256 7 555000000 Hz -5.0 dBmV 41.1 dB 417514174 0 0 9 Locked QAM256 8 561000000 Hz -5.2 dBmV 40.9 dB 417527003 0 0 10 Locked QAM256 9 567000000 Hz -5.4 dBmV 40.8 dB 417536341 0 0 11 Locked QAM256 10 573000000 Hz -5.5 dBmV 40.7 dB 417545995 0 0 12 Locked QAM256 11 579000000 Hz -5.7 dBmV 40.5 dB 417555551 0 0 13 Locked QAM256 12 585000000 Hz -5.8 dBmV 40.6 dB 417564329 0 0 14 Locked QAM256 14 597000000 Hz -6.3 dBmV 40.1 dB 417573756 0 0 15 Locked QAM256 15 603000000 Hz -6.3 dBmV 40.1 dB 417582985 0 0 16 Locked QAM256 16 609000000 Hz -6.4 dBmV 40.0 dB 417592167 0 0 17 Locked QAM256 17 615000000 Hz -6.3 dBmV 40.1 dB 417601644 0 0 18 Locked QAM256 18 621000000 Hz -6.8 dBmV 39.7 dB 417610832 0 0 19 Locked QAM256 19 627000000 Hz -6.7 dBmV 39.8 dB 417620137 0 0 20 Locked QAM256 20 633000000 Hz -6.7 dBmV 39.8 dB 417629173 0 0 21 Locked QAM256 21 639000000 Hz -6.8 dBmV 39.6 dB 417639118 0 0 22 Locked QAM256 22 645000000 Hz -6.9 dBmV 39.5 dB 417648523 0 0 23 Locked QAM256 23 651000000 Hz -6.9 dBmV 39.3 dB 417656229 0 0 24 Locked QAM256 24 657000000 Hz -6.7 dBmV 39.2 dB 417660056 0 0 25 Not Locked Unknown 0 0 Hz 0.0 dBmV 0.0 dB 0 0 0 26 Not Locked Unknown 0 0 Hz 0.0 dBmV 0.0 dB 0 0 0 27 Not Locked Unknown 0 0 Hz 0.0 dBmV 0.0 dB 0 0 0 28 Not Locked Unknown 0 0 Hz 0.0 dBmV 0.0 dB 0 0 0 29 Not Locked Unknown 0 0 Hz 0.0 dBmV 0.0 dB 0 0 0 30 Not Locked Unknown 0 0 Hz 0.0 dBmV 0.0 dB 0 0 0 31 Not Locked Unknown 0 0 Hz 0.0 dBmV 0.0 dB 0 0 0 32 Not Locked Unknown 0 0 Hz 0.0 dBmV 0.0 dB 0 0 0 Upstream Bonded Channels Channel Lock Status Modulation Channel ID Frequency Power 1 Locked ATDMA 1 36500000 Hz 43.8 dBmV 2 Locked ATDMA 2 30100000 Hz 43.8 dBmV 3 Locked ATDMA 3 23700000 Hz 43.3 dBmV 4 Locked ATDMA 4 17300000 Hz 43.3 dBmV 5 Not Locked Unknown 0 0 Hz 0.0 dBmV 6 Not Locked Unknown 0 0 Hz 0.0 dBmV 7 Not Locked Unknown 0 0 Hz 0.0 dBmV 8 Not Locked Unknown 0 0 Hz 0.0 dBmV Downstream OFDM Channels Channel Lock Status Modulation / Profile ID Channel ID Frequency Power SNR / MER Active Subcarrier Number Range Unerrored Codewords Correctable Codewords Uncorrectable Codewords 1 Locked 0, 1 159 702000000 Hz -5.7 dBmV 38.5 dB 1126 ~ 2969 357085159 19034 0 2 Not Locked 0 0 0 Hz -2.1 dBmV 0.0 dB 0 ~ 4095 0 0 0 Upstream OFDMA Channels Channel Lock Status Modulation / Profile ID Channel ID Frequency Power 1 Not Locked Unknown 0 0 Hz 0 dBmV 2 Not Locked Unknown 0 0 Hz 0 dBmV Current System Time: Wed May 09 14:59:48 2018
-
 Hello I have about 7 or 8 Android / PC machines of various types in my home. I also have a few QNAP NAS machines, Rasperberry PI's, NUC. I would like to remotely monitor system performance for each system on one device. Specifically, I would like to use something similar to windows event viewer. I could then filter the logs to give me an alert when I have a system fail, kernel corruption etc. Is there a program that does this?
 -
 Long story short, I was looking at my Apache server's logs on my status monitor (will probably make a post about that later), when I see a very peculiar DELETE request logged. Here it is, quoted in it's entire glory: Applying some google-fu reveals that this is not an isolated incident , and that the message originated from the CCC (https://www.ccc.de/en/), a European tech group. Has anyone else on the forum running a webserver gotten this awesome tidbit in their logs?
 -

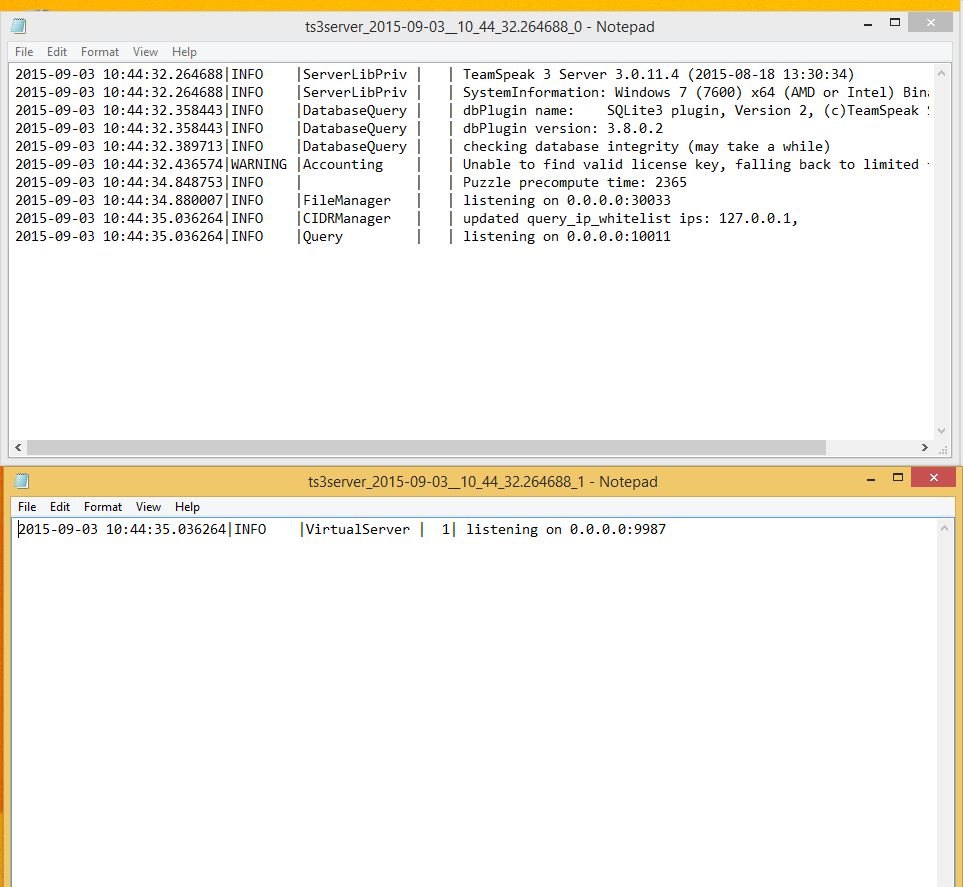
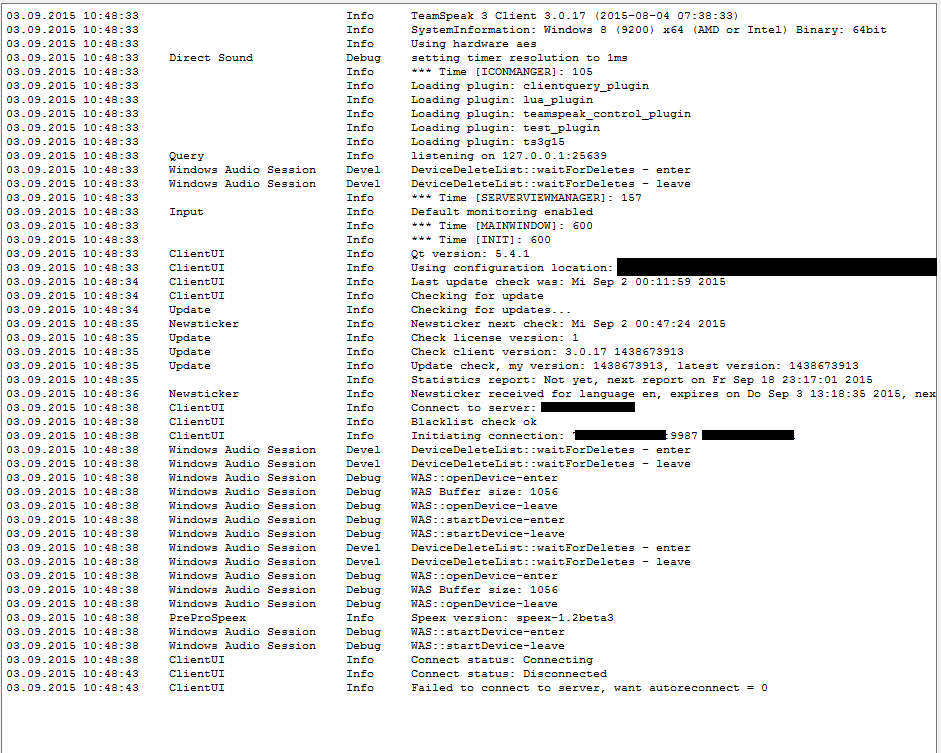
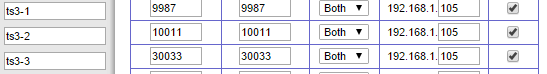
Cant connect to my Teamspeak 3 server using wan ip...
terrahertz posted a topic in Operating Systems
I am quite sure i portforwarded everything correctly on my router and that i have the correct wan ip but the only way i can connect is through localhost. Here are a few screenshots and the logs of the server and client. I am running Windows 10 pro 64-bit on my main pc while windows 8.1 pro 64-bit on the server pc. Hope its ok if i blacked out the ip... I also dont know why it says windows 7 on server log and windows 8 on client log. My router is the linksys wrt120n
-
Hey ppl, Is there any one out there who knows if it´s possible to measure VRAM usage? Not just allocated memory but actual usage. I know there are a few programs that measure allocated memory, but that does´t really say anything. I want to measure how much i´m using in different scenarios to know how much headroom i have to play with. (mods, if i have posted this one in the wrong section, im sorry. do you take bribes? i have cookies) Peace
-
 So I've set up log rotate in an Ubuntu server with the following settings: # see "man logrotate" for details# rotate log files weeklyweekly# use the syslog group by default, since this is the owning group# of /var/log/syslog.su root syslog# keep 204 weeks worth of backlogs, AKA 4 weeks short of 4 years worth.rotate 204# create new (empty) log files after rotating old onescreate# comment this if you don't want your log files compressedcompress# comment this if you want your log files compressed when they are rotated, rather than on the rotation after they are rotated.delaycompress# packages drop log rotation information into this directoryinclude /etc/logrotate.d# no packages own wtmp, or btmp -- we'll rotate them here/var/log/wtmp {missingokmonthlycreate 0664 root utmprotate 1}/var/log/btmp {missingokmonthlycreate 0660 root utmprotate 1}# system-specific logs may be configured here/var/www/html/chatsystem/subfolder/*log* {compress# compresses the log filescreate 0660 root administrators# creates new empty log files with the owner being rooterrors people@[member=Domain16].com# sends errors to people@[member=Domain16].commail people@[member=Domain16].com# sends log files to people@[member=Domain16].comolddir /var/log# puts the rotated logs in /var/logpostrotate/sbin/service httpd reload > /dev/null 2>/dev/null || trueendscript# reloads apache after moving log filesrotate 204# rotates and keeps 204 log files (4 years)weekly# rotates weekly} /var/www/html/chatsystem/subfolder/*log* {