Search the Community
Showing results for tags 'geekbench'.
Found 19 results
-

-
 Intel will introduce a hybrid CPU architecture codenamed Alder Lake that is built on a 10nm node. An apparent engineering sample (with 1.4GHz base clock) has found its way to Geekbench. While not exactly the same concept, the go-to comparison for Alder Lake is Arm's big.LITTLE design. Alder Lake will combine high-performance cores based on Intel's Golden Cove architecture, with power efficient cores based on Gracemont. In essence, Golden Cove would serve as the 'big' cores and Gracemont would serve as the 'small' cores. This could lead to some interesting configurations, whereby the number of threads will not necessarily be double the number of the total cores, depending on the SKU and arrangement. Source 1: https://www.tomshardware.com/news/intel-12th-generation-alder-lake-s-cpu-multi-core-performance-ryzen-5-3600x Source 2: https://videocardz.com/newz/intel-alder-lake-s-16-core-and-24-thread-cpu-appears-on-geekbench Source 3: https://www.techspot.com/news/88110-intel-10nm-alder-lake-s-cpu-engineering-sample.html Source 4: https://hothardware.com/news/intel-alder-lake-s-hybrid-cpu-leaks-16-cores-24-threads While the performance is nothing to get overly excited about, it is worth noting that being that it is an early ES chip, and currently clocking at only a measly 1.4GHz (and probably not much higher than that, as the reported boost clock is definitely incorrect). The single-core performance is practically the same as a mobile Ryzen 5 4600H @ 994 average points; a 6c12t CPU that boosts to 4.0GHz with a base clock of 3.0GHz (nearly 114% increase in clock speed compared to this Alder Lake ES sample). The multi-core performance is about equal to a Ryzen 5 3600X @ 6,906 average points; a 6c12t CPU that boosts to 4.4GHz with a base clock of 3.8GHz (nearly 171% increase in clock speed compared to this Alder Lake ES sample). Within that specific context, knowing that finalized clocks on the 12th Gen Alder Lake parts will be much higher, I would say that these early results/numbers are actually relatively notable, for the most part. Let us for example extrapolate performance real quick: equalizing the multi-core performance by applying base clock parity between the Alder Lake ES chip and the Ryzen 5 3600X; that would push the result of the Alder Lake ES Chip to around 18,800 points. Making its multi-core performance more in line with a Ryzen 9 5950X (a 16c32t part). In actuality, the Alder Lake chip would be faster on average compared to the 5950X, and that was with only a 3.8GHz clock speed enhancement to the Alder Lake CPU (compared to the current 1.38GHz number). Minor, but interesting update to this story ~ Source 5: https://www.notebookcheck.net/16-core-Intel-Alder-Lake-S-desktop-processor-s-SiSoftware-entry-reveals-specs-Xe-Gen-12-2-iGPU-details-30-MB-L3-cache-and-DDR5-memory-support.515770.0.html Source 6: https://videocardz.com/newz/intel-alder-lake-s-processor-with-16-cores-at-4-ghz-and-ddr5-4800-memory-spotted Source 7: https://www.tomshardware.com/news/alder-lake-s-cpu-hits-4-ghz-with-ddr5-memory
- 35 replies
-
- 1
-

-
- alder lake
- intel 12th gen
- (and 4 more)
-
Two entries of the AMD Ryzen 9 5950X have been spotted on the Geekbench database. One of these entries shows the AMD processor was running on an iMac Pro and it was clocked at 6.0GHz, which is quite the impressive figure. The Geekbench database entry identifies this system an as "Acidantheria Mac," which originates from a former Hackintosh outfit called OpenCore Computer. Source 1: https://browser.geekbench.com/v5/cpu/4190448 Source 2: https://hothardware.com/news/ryzen-9-5950x-hackintosh-score-geekbench Source 3: https://www.techpowerup.com/273426/amd-ryzen-9-5950x-16-core-zen-3-processor-overclocked-to-6-ghz-and-geekbenched Source 4: https://www.kitguru.net/components/cpu/joao-silva/amd-ryzen-9-5950x-running-on-imac-pro-overclocked-to-6-0ghz-spotted-on-geekbench/ There seems to be a mixed bag of opinions on this entry. Whether it is legitimate, and simply an extreme overclocking result / entry with exotic cooling; or not legit and perhaps an error entirely. Either way, it is interesting stuff as it means at the very least there is a possibility of better overclocking results on Air/Water with Zen 3 and the upcoming 5000-series. Something important to note, is that apparently the current LN2 record for a 3900X is 5.65GHz, therefore surpassing that by 300-400MHz is still quite an impressive feat (even if on exotic cooling).
-
 I was curious about exactly how the Intel 12th gen efficiency cores compare to the performance cores, so I wrote a script that runs Geekbench 5 against each individual core. I chose Geekbench for this test because it offers a nice mix of real-world algorithms rather than an arbitrary synthetic mix of computations. Here are the results for an i7-12700h running in an Asus Vivobook S 14X. Summary of results ----------------------------------------------- Core # 0: Average=1771.00 *** Baseline *** Core # 1: Average=1770.50 vs Baseline: 99.97% Core # 2: Average=1767.33 vs Baseline: 99.79% Core # 3: Average=1749.00 vs Baseline: 98.75% Core # 4: Average=1844.16 vs Baseline: 104.13% Core # 5: Average=1843.66 vs Baseline: 104.10% Core #12: Average=1091.66 vs Baseline: 61.64% Core #13: Average=1097.66 vs Baseline: 61.97% Core #14: Average=1096.50 vs Baseline: 61.91% Core #15: Average=1098.50 vs Baseline: 62.02% Core #16: Average=1097.83 vs Baseline: 61.98% Core #17: Average=1095.50 vs Baseline: 61.85% Core #18: Average=1097.16 vs Baseline: 61.95% Core #19: Average=1096.33 vs Baseline: 61.90% Cores #0-5 are the six native performance cores (hyperthreaded cores excluded); cores #12-19 are the eight efficiency cores. Core #0 is the 100% baseline. Based on these results the efficiency cores are 62% as fast as the performance cores on a i7-12700h. Note how cores #4 and #5 are faster than the other four performance cores - these are the "favored cores" on this particular CPU die. See Intel Turbo Boost Max Technology 3 for details. Here is a link to my GitHub repository if anyone would like to run this test on their setup as well. It runs under Linux. https://github.com/horshack-dpreview/GeekbenchAutomationTools
-
- 1
-

-
- alder lake
- geekbench5
- (and 3 more)
-
Summary Somebody has tested the RTX 4090 with the Geekbench CUDA benchmark. They did it at least twice, and the two results were very close: 417,713 points and 424,332 points as well. This particular RTX 4090 was tested on AMD’s latest X670E platform equipped with a Ryzen 9 7950X and 32GB DDR5-6000 memory. Quotes My thoughts I think this is a good showing of RTX 4090 performance, about 1.8x faster than a RTX 3090 and about 1.6x faster than a 3090 Ti. While this workload is heavily compute related, it still gives us a rough idea of raster performance. Seems to be about average compared to predecessors of previous generations, except here this is a 3090 Ti compared to a 4090. If the 3090 Ti is compared to a 4090 Ti, the full fat die of AD102, it will probably be around a 90% increase in performance (if those rumors of specs on full fat AD102 are correct). We have 10 days until RTX 4090 officially launches, so I'm expecting better leaks to come out before then that give us a better idea of gaming performance. Some might be disappointed by these numbers, based one NVIDIA's own numbers, but this is a very specific benchmark that doesn't specifically indicate gaming performance entirely. There is a chart on some of these sources that indicates "Current NVIDIA CUDA API Geekbench Rating" featuring the 3080 Ti, 3090, A100, and 3090 Ti and when compared to the 4090's result they get trumped. Sources https://www.guru3d.com/news-story/nvidia-geforce-rtx-4090-tested-in-benchmark-60-faster-than-rtx-3090-ti.html https://www.techradar.com/news/nvidia-rtx-4090-gpu-benchmark-leak-has-some-folks-disappointed https://videocardz.com/newz/geforce-rtx-4090-is-60-faster-than-rtx-3090-ti-in-geekbench-cuda-test https://hothardware.com/news/rtx-4090-benchmark-leak-60-percent-over-3090-ti https://browser.geekbench.com/v5/compute/5596628 https://browser.geekbench.com/v5/compute/5094052 Small update to this story: Summary 3DCenter.org released an article denoting the scaling between this Geekbench benchmark and gaming performance at 4K. They compared the 2080 Ti to the 3090 and saw similar gains in performance scaling between the Geekbench result and gaming at 4K results. Quotes My thoughts This is interesting to see as the scaling is quite close between Gaming performance and the Geekbench result. Meaning, it's quite possible that pure raster performance of the 4090 will be very close to 60-65% higher than a 3090 Ti. But there's also the increased L2 cache in Ada that might assist to increase performance further. Sources https://www.3dcenter.org/news/news-des-12-oktober-2022
-
Leaked Geekbench score running on Skylake-EP from Google running on Linux. Google did manage to get early access to these cpus and they are letting the consumers try it out, by signing up to their Google Cloud Platform. Skylake-EP Skylake-EP is part of the Purley Platform http://wccftech.com/intel-skylake-e5-2699-v5-32-core-geekbench-score-leaked/
-
 can dey?
 -
This question has been on my mind since apple started their push for better single thread performance. Why is it that a passively cooled ARM chip such as Apple's A10X can reach geekbench scores of 3900/9430 at 2.4 GHz while my i5 4690k scores the same at 3.5 GHz but consumes 35-44w at the package level? According to Wikipedia Apple's A10 (Not X) already uses 3.3 billion transistors while a i7-6950X uses 3.2 billion. Can the GPU make such a difference? Are these benchmarks even comparable or has Apple found the optimal architecture design in less than 6 years? A10X source https://www.notebookcheck.com/Apple-A10X-Fusion-SoC-Prozessor-Benchmarks-und-Specs.227170.0.html https://en.wikipedia.org/wiki/Transistor_count
-
Here's my specs; i5 760 overclocked to 3.5 GHz 8 GB ddr3 ram (Soon to be 16) Current graphics cards are 2 Radeon 5670's crossfired What do you guys think the "sweet spot" would be, so that I'm getting the most performance out of my CPU without bottle necking the GPU Looking to spend around $300. (Though less is better, but also willing to spend more if it'll make a noticeable difference) Also attaching my My cpu-z and Geekbench 4 scores Thanks guys!
-
So I just a tad confused when I ran my geekbench benchmark on my ryzen 9 3900x my multicore score was under 28000 and I was like I know it should be better then that......So I ran it again and saw that geekbench was reporting that I have 1 processor with 6 cores and 12 threads..... is there anyway to fix this or do I have a more serious problem on my hands??
-
 I bought a XPS 15 9560 in December 2017. The laptop is under premium warranty. My Laptop started running slower. Approximately 1/3 of the speed to be precise. The CPU seems to be not working as it was meant to work. Software side everything has been tried and tested from Clean installing WINDOWS to updating all the drivers and even BIOS. I have conducted benchmarks using softwares like GeekBench, CineBench etc and all the tools gave me the same result. Geekbench report gave me 1236 for Single core and 4573 for multi-core performance. I am attaching a report of a test conducted by DELL service centre of my laptop. Even the Report from the Service centre shows the same. In the report the FLOATING POINT UNIT TEST for CPU it shows that my CPU scores a pathetic 469 MFLOPS. The actual value should be near 179200 MFLOPS (According to Intel, PDF of the same is attached below) I have been a DELL user for 15 years now and have changed over 3 Laptops over time. Being a loyal user to the brand for years now I am heart broken at this moment as the escalation team seems to be not helping me by any means and I am left with no option but to write here for a solution. Please help me with my problem as I am an independent filmmaker and this laptop is an investment for me and now it seems like my money has gone to waste ad the laptop is almost of no use to me now. Please point out what can be the issue. 9JN2MH2_report.html APP-for-Intel-Core-Processors.pdf
 -
.thumb.gif.6c208fabb86f0f3f5be1b0ccf62fe67f.gif) Sources: Winfuture.de via Slashgear That is disappointing. Just look at the Galaxy Note 8 with the same SoC: I know how people in the forum tend to be dismissive of synthetic benchmarks including Geekbench but remember for the most part, devices scoring high in Geekbench are the ones that actually perform very well. Since Geekbench is an x86 application, it must be running on the x86 emulation layer of W10 on ARM and Microsoft promised users that many of their existing x86/64 applications will run just fine on an ARM Windows 10 device. I don't think with emulation an application can run on its native speed nor can use the hardware efficiently but if those abysmal Geekbench scores is an indication on how a typical x86/64 app will run on a Windows 10 tablet running on Snapdragon 835, I think this might be headed for another Windows RT flop unless Microsoft has some other tricks up its sleeves that can change things. Windows 10 on ARM looks just like Windows 10 on an Intel/AMD PC and both can run Windows Store apps and x86/64 apps that aren't on the store and yet the performance is way better on an Intel/AMD tablet. It's obvious that Microsoft is positioning these upcoming ARM based PCs running on Windows 10 to go head to head with iOS, Android and Chrome OS but I think they're giving way too much promises here. While an iPad can only run apps from the app store, as a user I am sure that the thousands of iPad apps will run just fine and take advantage of the hardware because it's running natively unlike an ARM Windows 10 PC which can run UWP apps and some x86/64 applications but not as fast as a laptop with AMD/Intel inside. Also, there are many games in the Windows Store that are x64 exclusive. Are these incompatible apps will appear on the screens of Windows 10 on ARM users? They might get the wrong impression just because their device can run Photoshop means it can run games found on the Windows Store. I could be wrong here but I think Microsoft is creating once again a hot mess they tried to erase when they ceased development of Windows RT by trying to be everything at once.
Sources: Winfuture.de via Slashgear That is disappointing. Just look at the Galaxy Note 8 with the same SoC: I know how people in the forum tend to be dismissive of synthetic benchmarks including Geekbench but remember for the most part, devices scoring high in Geekbench are the ones that actually perform very well. Since Geekbench is an x86 application, it must be running on the x86 emulation layer of W10 on ARM and Microsoft promised users that many of their existing x86/64 applications will run just fine on an ARM Windows 10 device. I don't think with emulation an application can run on its native speed nor can use the hardware efficiently but if those abysmal Geekbench scores is an indication on how a typical x86/64 app will run on a Windows 10 tablet running on Snapdragon 835, I think this might be headed for another Windows RT flop unless Microsoft has some other tricks up its sleeves that can change things. Windows 10 on ARM looks just like Windows 10 on an Intel/AMD PC and both can run Windows Store apps and x86/64 apps that aren't on the store and yet the performance is way better on an Intel/AMD tablet. It's obvious that Microsoft is positioning these upcoming ARM based PCs running on Windows 10 to go head to head with iOS, Android and Chrome OS but I think they're giving way too much promises here. While an iPad can only run apps from the app store, as a user I am sure that the thousands of iPad apps will run just fine and take advantage of the hardware because it's running natively unlike an ARM Windows 10 PC which can run UWP apps and some x86/64 applications but not as fast as a laptop with AMD/Intel inside. Also, there are many games in the Windows Store that are x64 exclusive. Are these incompatible apps will appear on the screens of Windows 10 on ARM users? They might get the wrong impression just because their device can run Photoshop means it can run games found on the Windows Store. I could be wrong here but I think Microsoft is creating once again a hot mess they tried to erase when they ceased development of Windows RT by trying to be everything at once.
-
Hello everyone! Recently I got an iPhone 7 Plus 128gb in black and the first thing I did was a geekbench test. The phone got a solid 4900 multi core which I noticed was slightly slower than that of YouTuber's but I dismissed it as a bad test and just unlucky. Fast forward a week and I do another test and notice that now my score is 2500!!! I have no explanation as to what on earth is happening but could anyone explain what could be happening and how to remedy this issue. Thanks in in advance if anyone can help me with this issue, Alex
-
Hi so i am not sure if there is already a post about it but i am trying to accomplish to make a list of the performance of phones (ANY PHONE even iphones if you like, windows phone may be added but i am not sure about the support of antutu and geekbench 3) and ofcourse you can look them up but it would be nice if there is just a place where you can see it all at ones without looking all over the internet and just see it on your favorite forum . (i know anandtech has some charts but its limited ) so the first phone to be added to the list is my own moto x 2014 with anTuTu and geekbench scores. First, To make things clear i know this is in some way REALLY unnecesery but i would like to do it and you don't have to respond but any posts would help (Taking it to the next level with my posting skills) How to post results 1. Test your phone with Antutu, Geekbench 3, GFXbench 3.1 or 3.0 (when posting STATE CLEARY which one and also optional ) and 3DMark Ice storm Unlimited and Ice storm Extreme as optional since its massive to have on a phone and some don't even have the storage for it. (if its a really poor device a Ice storm normal may be sufficient) Now make a screenshot/share and save it after you done the benchmarks. I would recommend to have it more accurate to do more benchmark runs and make a average (or post it here and ill do it for you ) (on android it default is lower volume + power button and hold it for a couple seconds (from 4.0.4 ) some older devices might not support it so here is a article with alternative options, some phones also have the keys rebound to a other key http://bit.ly/1JamF2M ) (On the iphone press and hold the Sleep/Wake button on the top or side of your iPhone, iPad, or iPod touch, then immediately press and release the Home button) (and for the windows phone its the power button + volume up and hold for a couple seconds ) 2. Send it to your email or post it on your phone which is possible without cropping if the resolution isn't to high (720p or lower) and use the full desktop version (2MB max and 720p is 1.4 mb and 1080p 3.1 mb calculate here what size your resolution MB size is http://web.forret.com/tools/megapixel.asp) 3. Post it here with your phone model ofcourse (example: Samsung Galaxy S6 edge 64 GB model) (since some phones swap ram,storage and even cpu with different models) 4. then let me do the work, I don't know if a lot people respond and i can keep up but maybe there is nobody that wants to give a crap. 5. enjoy the charts How to Run the benchmarks best as possible -disable any on the background running apps so on android exit all your programs end your facebook,twitter ect procceses which you can launch to make active again. -disable GPS and any 4G and if you have android any custom launcher's (which are via the play store not ROM's ofcourse) Benchmarks: 3DMARK: https://play.google.com/store/apps/details?id=com.futuremark.dmandroid.application Geekbench 3 https://play.google.com/store/apps/details?id=com.primatelabs.geekbench AnTuTu https://play.google.com/store/apps/details?id=com.antutu.ABenchMark Keep in mind that i still have school so don't expect instant updates
-
I have an iPhone 6s Plus, which I got in late October. The first two weeks of having it, CPU Geekbench scores were shown as follows. I took another one today, and it's significantly less than when I first got the device. Any thoughts?
-
 So, I'm back with another review... A little story first... I was in need of a new phone since my Alcatel One Touch 5021E (m'pop/soleil) couldn't keep up with my needs anymore... Luckily, my contract was due for a renew and this phone was available (after a ~25USD cash out)... LENOVO A536 Introduction The Lenovo A536 is Lenovo's 5" phone at the 100-150USD price bracket. The phone features the ff. specs.: (more complete specs here) SoC: MediaTek MT6582M (Cortex A7, Quad Core, 1.3GHz) GPU: Mali 400MP2 RAM: 1GB Storage: 8GB expandable Camera: 5MP (AF) LED Flash Battery: 2000mAh Dual sim, dual standby. Screen: 5", 480x854 (195.93ppi), two point capacitive touch screen OS: Android 4.2.2 KitKat The phone has a glass front, and a gloss plastic back with chrome accents. Unboxing Unboxing this thing was not that pleasant... Box is pictured above... The sticker above is the seal of the carrier where I got it from, control numbers are censored. The box contains the ff: unit wall charger micro USB cable screen protector jelly case headset battery Instruction manual warranty card NTC certification Quick Start Guide Usually, when a screen protector comes enclosed, it implies that the screen is of a low quality, however, mine had a screen protector pre-attached, and an extra enclosed in the package. Lenovo also included a low-profile jelly case with a matte finish... Benchmarks To kick things off, I had it go under Antutu... Here are the results side by side with my previous phone, the Alcatel One Touch 5021E Antutu v. 5.6 Lenovo A536 Alcatel 5021EOverall 19582 11244UX Multitask 3042 2335UX Runtime 1169 966CPU Integer 1663 709CPU Floating Point 1770 769CPU Single-threaded Integer 1185 1004CPU Single-threaded Floating Point 972 863RAM Operation 1435 693RAM Speed 2092 635GPU 2D 1267 541GPU 3D [854x480] 3604 [800x480] 1684Storage I/O 743 440Database I/O 640 605 Performance-wise, it's an upgrade, although the screen density is a bit lower... Commentary The build quality leaves something to be desired... The phone feels a bit too light and fragile, and the gloss back cover is a turn-off... Luckily, Lenovo included a matte-jelly case that does not ruin the experience of the phone... For a 7000PhP SRP phone, it's pretty nice... As for the included bloatware, it's only Lenovo's launcher and themes, the carrier's stuff, and Lenovo's security/optimizer app... which is small compared to what came with the Touchmate Rainbow 7. The Lenovo Launcher was a bit distasteful for me as it attempts to imitate that of iOS, but with more features, so I went ahead and installed Smart Launcher 2 to give it a cleaner look that blends well with Material Design. The optimizer/security app is useful in this case, especially when Android decides to keep all the apps in cache. I don't need a third party optimizer in this case. For a single night of use, I was able to get a general feel on how to operate this phone, and since I've got tiny hands, I'll have to operate this with 2 hands. The touch screen is accurate and responsive so typing on it is not a chore. The audio is also good for a phone. Reception, both wifi and cellular, are fluctuating, but I can attribute that to my house. Conclusion The phone is very nice for its price. The build quality leaves much to be desired and the gloss back cover is just not my taste. Lenovo includes a jelly 'd case which is good since I won't have to look for one and spend more... I'd include more images but I don't have a good enough camera to capture the phone properly... I'll update this thread/post after a month of daily use to give a more in-depth look so stay tuned. -Hermit
 -
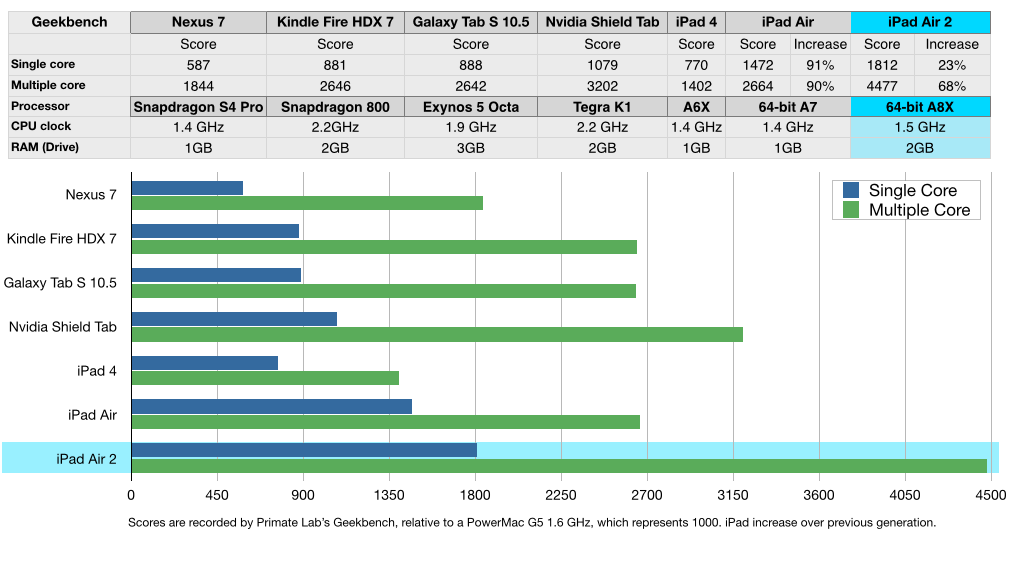
 Here is a compression between the new iPad Air 2 and some other iOS & Android tablets.
-
I've seen some benchmarks of the IPhone 5S versus the Note 3 or S4 and it always wins. I know benchmarks aren't the key to a good phone, but why does it win by so much even though the Android devices have much beefier specs? Is it also faster in real life?
-
 Summary A leaked benchmark of the MacBook Air 10,1 has appeared on Geekbench database showing a single-core score of 1687 and a multi-core score of 7433. Notably, this is score higher than any other Apple Silicon, and the 16-inch MacBook Pro with an Intel Core i9-9980HK. What's also to note is that the single-core score is higher than any Mac ever released, even the $59,999 Mac Pro, and in fact is one of the best single-core scores in the industry, only slightly edging out the just released Ryzen 9 5950X... on a laptop without a fan. The Mac mini result appears to be on the database as well, but shows a similar score. Quotes My thoughts Five words. Moore's law is not dead. It could be possible that the M1 breaks Geekbench 5 in a way CPUs broke Geekbench 4 and a theoretical Geekbench 6 may be better in line to compare these chips with x86 chips, but at face value holy shit. On a LAPTOP?! Imagine what they can do on a fucking Mac Pro... What's next? The M1 GPU can outperform a 1660Ti with a fraction of the power? I assume the difference between the MBP/Mac mini and the MBA is that the former can run sustained without throttling. I refuse to believe Apple broke the laws of physics. But then that actually bothers me. They must've limited the chip to the power constraints of the MBA. Why not expand it for the Mac mini? It has an actual cooling system. There's much more thermal headroom for the Mac mini for it to run faster. I just assume the M1X and M1Z must be too power-hungry to fit in the Mac mini so they just put the M1 in it for now. I personally believe these results to be valid, I mean remember this isn't x86 code that's going to be running on this. macOS itself is processor independent, so the system isn't running any emulated components, and all the apps around it and built for ASi will use ARM instructions. Also, if an x86 instruction requires 3 ARM equivalent instructions, is an ARM CPU with 3.1x IPC than the x86 CPU not definitively faster? Food for thought. I apologize for getting a little excited, now bring me back to reality! It just seems too good to be true. So good that it's probably true... Sources https://www.macrumors.com/2020/11/11/m1-macbook-air-first-benchmark/ https://browser.geekbench.com/v5/cpu/4648107 https://browser.geekbench.com/v5/cpu/4648680


.thumb.jpg.24da69eef964f5222d77b6d665da8858.jpg)


.thumb.gif.6c208fabb86f0f3f5be1b0ccf62fe67f.gif)